
Drawing graphs
When you are
carrying out a science experiment, the easiest way to show your results
is by drawing a graph, but a problem common to many students is that
they don't know how a graph is drawn. It's not just marking the points
and connecting them. Today we give you some guidelines to draw a better
graph.
General tips
Make your graphs as big as possible. Preferably, use the whole page,
with the edge of the paper actually being the axis, so you don't need to
draw the axes, and everything is as clear and big as possible.
Make the data points as small as possible. It also helps if you dont
connect the data points. After all, that's why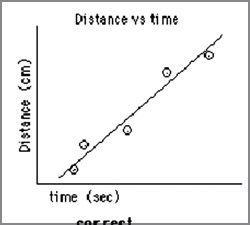 they are called data points, not data lines!
It's probably better to do a graph in pencil first, rather than
starting with the pen.
1. Collect your data
After you have it all in one place, you should have one independent
variable (like time) and one dependent variable (like something you
measure as a function of time).
2. Determine the range of your
data
In order to determine how big a graph should be, we need to determine
how much the numbers vary. We have to make sure that there is enough
space on the graph to fit all the data.
You should always try to minimise the free space in the sheet. Free
space should not exceed the space used by the graph. The independent
variable will go on the X axis, and the dependent variable will go on
the Y axis.
3. Label your graph and your axes
When presented with your graph, other people should be able to figure
out what is plotted without having to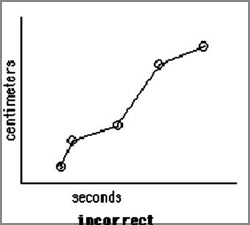 ask you. Titles of graphs are usually 'Y versus X'. Labels on the axes
must have units.
ask you. Titles of graphs are usually 'Y versus X'. Labels on the axes
must have units.
Remember to write the numbers in the axes. The numbers should be
evenly and logically spaced, ex 1,2,3,4 or 2,4,6,8 and not 1,3,2,6,4,9.
4. Plot your data
Now, go ahead and place your data points on the graph neatly and
clearly.
5. Draw a 'line of best hit'
This does not mean to connect the dots! Only rarely will a graph need
to have the data points connected by a jagged line. Usually, it is best
to guess at a line that goes near as many points as possible. The origin
is not always included as a point! Sometimes, there will be a lot of
scattered points and it may not be clear where a line should go.
6. Now you are done with your graph.
Think about what the graph means.
The slope of the line that you drew describes how fast your line rises
(or falls).
To find the slope of your line, pick two points on the line, as far
apart as possible. These two points are described as (X1, Y1) and (X2,
Y2). The slope is given by (Y2-Y1)/(X2-X1). You must always keep in mind
to put the units of the slope, (unit of Y axis/unit of the X axis).
Happy graphing!
Man-made magic
A long time ago, not even a millionaire's daughter could buy a pair
of nylon stockings. No money in the world
|
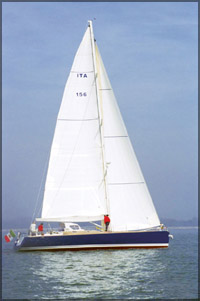
Sails are made of nylon
|
could buy a nylon shirt or a nylon sweater. All clothing was
woven from fibres which came from plants or animals. Man hadn't yet
learnt to make fibres from chemicals that could be woven into wearable
things.
In 1927, a big American chemical company became interested in seeing
what would happen if, in the laboratory, many small molecules were
joined together to make one very long molecule.
Walter Carothers, a chemist, found that if he took a mass of stuff
consisting of these big molecules while it was in liquid form and forced
it, under high pressure, through many little holes, it came out as long,
strong fibres. Scientists were quick to realise that a marvellous new
product had been born.
This was how nylon, one of the first chemically-made materials, came
about. In 1938, the discovery was introduced in the form of nylon
toothbrush bristles. The next year, nylon stockings came out. Until
these were introduced, women had always worn silk or cotton stockings.
In a few years, silk and cotton stockings all but disappeared from
store shelves. Nylon started a fashion revolution.Today, nylon is used
for many things other than to produce stockings or wearing apparel. It's
used to make sails for boats, parachutes and cords for automobile tyres.
Engineers are even beginning to use nylon gears in machinery, because
this man- made fibre is very strong.
Compiled by Janani Amarasekara |