|
The Wealth Gap - inequality in numbers:
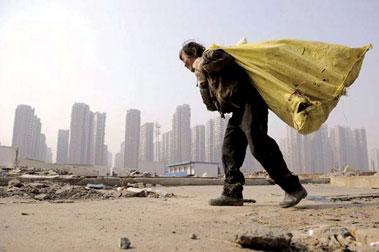
Protests highlight inequality debate
Until protectors took to the streets last year, first in New York and
then in financial centres across the world, inequality had been a
low-key issue.
 Not any more. With the political temperature rising, a stream of new
analysis is revealing how sharply inequality has been growing. Not any more. With the political temperature rising, a stream of new
analysis is revealing how sharply inequality has been growing.
In October, the US Congressional Budget Office (CBO) caused a storm
by revealing how big a slice of income gains since the late 1970s had
gone to the richest 1 percent of households.
The message was dramatic. Over the 28 years covered by the CBO study,
US incomes had increased overall by 62 percent , allowing for tax and
inflation.
But the lowest paid fifth of Americans had got only a small share of
that: their incomes had grown by a modest 18 percent . Middle income
households were also well below the overall average with gains of just
37 percent . And even the majority of America's richest households saw
gains of barely above the overall average at 67 percent .
How does that make sense?
Because the CBO found most of the income gains over the past 30 years
had gone to the top 1 percent of US households. Their incomes had almost
trebled with rises of 275 percent. In Britain, Danny Dorling, Professor
of human geography at Sheffield University, has looked back even further
into history. He's charted the share of national income going to the
richest 1 percent since 1918, the end of World War I.
After falling for more than half a century, Prof Dorling said, the
share of Britain's richest 1 percent started rising sharply and
inequality is now on course to return to what it was in 1918.
Even within the richest 1 percent, inequalities are now enormous. At
the lower end of this tiny group of high earners, Prof Dorling said you
find people earning £120,000 a year. But the richest thousand
individuals leave them far behind.
They saw their wealth increase on average in 2010 alone by £60m. That
was a 20 percent gain, following 25 percent the previous year.
In November, the revelation of the size of the increases enjoyed by
chief executives of the 100 largest companies on the London Stock
Exchange triggered the most political anger.
The High Pay Commission reported that these executives' total pay had
risen by 49 percent during the previous year alone, compared with
average increases of less than 3 percent for their employees.
The rise left the chief executives with average pay of £4.2m. That
was 145 times the average pay of their employees and 162 times the
British average wage.
Responding to the High Pay Commission report, Prime Minister David
Cameron this month promised government moves against undeserved high pay
awards. Internationally, vastly more information on incomes is now
readily available.
Last year, the Paris School of Economics launched an ambitious
project: the World Top Incomes Database, providing resources online to
allow anyone to examine income inequality.
For The Wealth Gap series, we used that data to examine pay at the
very top of the British income scale between 1997 and 2007. We then
compared that with the average income of the vast majority - represented
by the bottom 90 percent .
This simple analysis reveals striking differences between the rich
and most of the rest of the population. In 1997, the entire bottom 90
percent had average income of just over £10,500. The top 1 percent had
incomes 18 times bigger.
At the very top - the top 10th of one percent - the multiple was far
higher. In 1997, their income was more than 60 times the average of the
bottom 90 percent. - BBC
|


")

