Rising waters: how fast and how far will sea levels rise?
Although the
latest UN climate report significantly increases its projections for sea
level rise this century, some scientists warn even those estimates are
overly conservative. But one thing is certain: predicting sea level rise
far into the future is a very tricky task.
by Nicola Jones
When the scientists on the Intergovernmental Panel on Climate Change
(IPCC) sat down to hash out the chapter on sea level rise for their new
report, which was released last month, they had their work cut out for
them.
 |
|
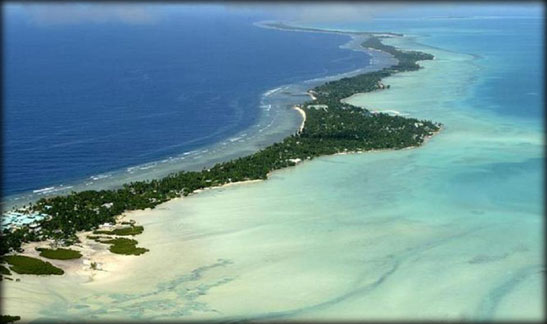
Islands are losing
weight due to rising sea waters |
Sea level forecasts were the most controversial part of the previous
report, issued in 2007: Scientists and the public alike bristled at the
low-ball estimate of under 60 centimetres (nearly two feet) by 2100,
which, the IPCC admitted, did not include the possibility of rapid ice
flow from Greenland or the Antarctic into the sea. That was clearly
important - those two ice sheets alone hold enough water to raise sea
level by 65 metres, compared to 0.4 meters from all the world's mountain
glaciers. But researchers' understanding of the ice sheets was so
uncertain, the IPCC said, they just couldn't bring themselves to put a
number on it. "Some things had to be neglected," says Don Chambers, sea
level researcher at the University of Texas.
"Because of that, the projections were on the low side."
Things today are more certain. In its latest report, released on
September 27, the IPCC finally could and did put a number on ice flow
from the poles. The result was an estimate of sea level rise of 28 to 98
centimetres (a maximum of more than three feet) by 2100 - more than 50
percent higher than the 2007 projections. "We have our arms around the
problem well enough to say there's a limit to how crazy things are going
to get," says Ted Scambos, head scientist at the U.S. National Snow and
Ice Data Center.
But that doesn't mean that everything about sea level is now
understood. Far from it. Big questions still hang over the fate of the
ice sheets, which, the IPCC admits, could bump up the most recent
projections by tens of centimetres. And there are a ton of smaller
factors for researchers to come to grips with.
Bathtub
The ocean doesn't rise steadily like water poured into a bathtub -
instead there are splashes and jiggles in its rise. Weather patterns
such as El Niño can shove tens of centimetres of water up onto shores
for months at a time, as they did in California in 1998. Floods in
Australia in late 2010 strangely resulted in water piling up on that
continent, robbing the oceans of enough water to lower global sea level
by seven millimetres for more than a year. While the ocean grows, the
land also shifts: The ground rises where it was once pressed down by
glaciers, and river deltas sink as loose sediments compact. What looks
like sea level rise in one place might really be the result of the land
falling.
All this means that unravelling what the oceans are doing today is a
heinously complicated task. Extrapolating their behaviour is even
trickier. "Predicting that into the future is very problematic," notes
Chambers. Says Steve Nerem at the University of Colorado, "We all think
we're committed to a metre of sea level rise. We just don't know exactly
how quickly."
Some facts are well established. Researchers can say that global
ocean levels have risen about 19 centimetres in the past century. And
the rate of rise has sped up. The 20th-century average is about 1.7
millimetres per year; since 1993 the average rate has nearly doubled -
to about 3.2 millimetres per year. Those sweeping statistics about
decades-long trends haven't changed much since the last IPCC report in
2007. The devil, of course, is in the details.
One problem has been attributing what, exactly, has caused the rise
seen so far. Since the 1970s, for example, it is thought that about 40
percent to 50 percent of sea level rise was caused by 'thermal
expansion' - the fact that water simply takes up more room as it gets
warmer; 35 percent by melting glaciers; five percent because people have
been extracting groundwater, using it, and pouring it into the ocean;
and the remaining amount probably from melting ice at the poles. The
primary reason this accounting is tricky is spotty data: Satellite
measures of ocean height only go back to 1993, for example, and of the
world's more than 100,000 glaciers, there are only 17 with melt records
going back 30 years or more. "We have to make huge assumptions," says
Chambers.
Melt
Another problem is untangling short-term from long-term trends. The
rate of sea level rise has mysteriously slowed down in the most recent
decade, for example. The leading theory is that this blip is due to heat
being sucked up by the deeper, colder parts of the ocean; cold water
simply doesn't expand so much on heating as warmer water does, so the
sea level rise is less, says Nerem. But the slowdown isn't expected to
last.
By far the biggest question remains how fast and far the polar ice
sheets will melt. For this, researchers have one key helper: the Gravity
Recovery And Climate Experiment (GRACE). Launched in 2002, these two
satellites detect the mass of the ground beneath them, and so can be
used to monitor the changing weight of the ice caps. "GRACE was a game
changer," says Jerry Meehl, a climate modeller at the U.S. National
Center for Atmospheric Research in Boulder, Colorado. "Before that they
were guessing."
Even GRACE is not clear-cut, however. The satellites detect the end
result of a combination of effects, including the change in mass caused
by the shifting crust and mantle, increased snowfall, and loss of ice
from melt or iceberg calving. So results are open to interpretation: The
2012 GRACE estimate for ice loss from the Antarctic was just half the
best guess from 2006.
In Greenland, researchers have seen the rate of ice melt double since
the 1990s, and warm water licking at the edge of the island has
increased glacier calving into the sea. More snow is falling, but
overall the island is losing weight and is expected to continue to do
so.
"For Greenland we can be confident now we really know what's going
on. All the methods are converging," says Philippe Huybrechts, an ice
modeller at the Brussels Free University. Worryingly, the IPCC expects
there is some global threshold - as low as 1 degree C, or as high as 4
degrees C above pre-industrial temperatures - beyond which Greenland
will irreversibly melt away over hundreds of years. We're already 0.85
degrees C warmer than 1880.
The picture of the Antarctic is far fuzzier: The error bars on IPCC
projections mean that the panel cannot even say for certain that the
continent will lose mass by 2100; it may actually gain a bit in the
short term.
The IPCC expects to see much more snowfall, particularly in the east,
and it should remain too cold for the ice to simply melt away.
But the continent is also losing ice from its edges as warmer water
causes ice shelf collapse. There is a chance that this ice outflow could
cause runaway collapse of the entire western Antarctic ice sheet.
This could add several tenths of a meter to global sea level rise by
2100. "There is a lot of ice there," says David Vaughan with the British
Antarctic Survey. "If it is knocked out of balance, Antarctica could
quite easily become the dominant contribution."
Predictive
In the face of all these uncertainties, some have taken a different
predictive approach.
Instead of trying to model the physics behind every process
contributing to sea level rise (from thermal expansion to melting ice),
they argue, why not instead simply look at how sea levels have
corresponded to temperature over hundreds of years and extrapolate?
These so-called 'semi-empirical' models tend to top out twice as high as
the 'process-based' models, making 2 metres of sea level rise feasible
for 2100 - enough to flood the homes of 187 million people. But the IPCC
says it doesn't have much confidence in these results.
"They're interesting," says Chambers, "but I don't think they should
be given as much weight as the process-based models."
A few scientists disagree, including Stefan Rahmstorf of the Potsdam
Institute for Climate Research, who works on semi-empirical models. "We
have two different approaches, and they give different results," says
Rahmstorf. "I don't know which one is closer to the truth.
But I object to the IPCC selecting one type and dismissing the
other." Other reports, notes Rahmstorf, including a 2012 assessment by
the U.S. National Oceanic and Atmospheric Administration, give more
pessimistic sea level predictions, going up to two metres by 2100.
Another way to capture the range of expert opinions is to do a formal
"expert elicitation" - a structured way of simply surveying experts and
asking them what they think.
When two dozen ice experts were surveyed in 2012, their best guesses
for polar ice loss were all over the map - but their average was higher
than the IPCC's estimates, and their range easily put sea level rise
over a meter by 2100.
For a middle-of-the-road emissions scenario, for example, this group
guessed at a sea level rise of 33 to 132 centimetres; the upper bound of
that is roughly in line with semi-empirical models, but nearly double
the IPCC's most recent estimate (which allows, to be fair, tens of
centimetres of wiggle room for possible dramatic ice sheet flow from the
Antarctic).
"The [IPCC's latest] AR5 process-based projections appear optimistic
and over-confident when compared with views of ice sheet experts,"
writes glaciologist Aslak Grinsted of the University of Copenhagen on
his website. There is "no good reason" for this, he said. This debate
about whether there will be one or two metres of sea level rise by 2100,
however, pales in comparison to the numbers for the long-term outlook.
The last time the planet was steadily two degrees C warmer than
pre-industrial times, some 120,000 years ago, sea levels were five to 10
metres higher than today. It's likely we'll hit 2 degrees C of warming
by 2100, unless we take extreme measures to mitigate emissions. "The
bigger concern is the longer term," agrees Scambos.
"By the end of this century the rate of change in Greenland will be
so high that the next hundred years will be dialled in for significant
sea level rise."
And any given city may have to contend with worse. While 70 percent
of the world will see local waters rise within 20 percent of the norm,
others will see extremes. In China, the Yellow River delta is currently
sinking so fast that local sea levels are rising by up to 25 centimetres
per year, nearly 100 times the global average.
Places that were once covered by kilometres of ice, like northern
Canada, are now rebounding upwards - which means local sea levels are
actually falling in some parts of Alaska. But that upward-moving land is
hinging nearby areas, like the US East Coast, downward by millimetres
per year - adding millimetres per year to the local sea level rise
there.
The U.S. East Coast has another problem too: Climate change is
weakening the Gulf Stream current, and that is allowing water to slop
back towards shore. Overall, the U.S. East Coast is seeing rates of sea
level rise that are three to four times the global average. The tropics,
meanwhile, are seeing extra sea level rise thanks to a strange
gravitational effect. As high-latitude ice melts, there is less mass at
the poles to pull ocean water towards them; instead, the water slopes
more towards the equator. No matter which way you look at it, the result
is cause for concern.
"I always tell people if they live under three feet above sea level,
they should be worried about the next 100 years," says Chambers. "We
probably can adapt to a certain extent. The problem is that we're not
planning for it."
- Third World Network Features
|


")

